Construction Emissions Uncovered: Turning Hidden Emissions into Net Zero Action
2025-06-27
In the 11th session of the Navigating Net Zero series, we explored one of the most overlooked and challenging emission sources—construction-related GHG emissions. The session offered a practical deep dive into carbon accounting for a real construction project and outlined how these emissions can impact a company’s net-zero strategy.
Case Study: A Commercial Campus Construction in India
We examined the carbon footprint of a large public sector undertaking (PSU) constructing a commercial headquarters campus with: - Total construction area: 78,443 sqm - Three parts: Block A (B+G+M+7F), Block B (B+G+M+12F), and MLCP with staff quarters (7F each) - Dedicated DG shed and services building already constructed
Important Note: Construction was outsourced to a construction company, while the emissions reporting was required for the PSU (the reporting company).
Understanding the Boundaries for GHG Accounting
Organizational Boundary
- Construction Company: Executes the work
- Reporting Company (PSU): Takes operational control post-construction and is responsible for reporting capital goods emissions
Operational Boundary
GHG inventory was limited to the construction phase, excluding operational or post-handover emissions.
Carbon Accounting Approach & Activity Mapping
Carbon emissions = Activity Data × Emission Factor
Activity Data Types
- Fuel consumption (litres/kgs)
- Electricity use (kWh)
- Materials used (kgs, sqm)
- Transportation distances (ton-km)
- Waste generated (kgs)
Emission Factor Sources
- CEA India (electricity)
- UK DEFRA (transport, fuels)
- ICE Database (construction materials)
- India GHG Program, USEPA
Scope-Wise Emission Categorization
Scope 1 (Direct Emissions)
- DG set diesel use: 15,000 L → 40 tCO₂e
- Construction vehicles: 10,000 L → 27 tCO₂e
Scope 2 (Indirect Electricity Use)
- Grid power for construction: 4 million kWh → 3,312 tCO₂e
Scope 3 (Value Chain Emissions)
Purchase of Goods & Services:
- Cement (15M kg): 12,866 tCO₂e
- Steel, concrete blocks, tiles, admixtures, etc.
Upstream Transportation:
- 69 million ton-km → 6,900 tCO₂e
Employee Commuting:
- Mixed transport: ~1 tCO₂e
Upstream Leased Assets:
- Equipment like cranes/saws: 7,700 tCO₂e
HVAC System:
- 4,500 TR estimated → 6,667 tCO₂e
Electricals & Furniture:
- 3,500 sqm (furniture): 123 tCO₂e
Waste Generated:
- 2,680 tons of waste → 1,954 tCO₂e
Fuel and Energy-Related Activities:
- Well-to-tank emissions and T&D losses
Downstream Transport:
- Waste to landfill → 8.04 tCO₂e
Total Emissions Summary (Construction Company Perspective)
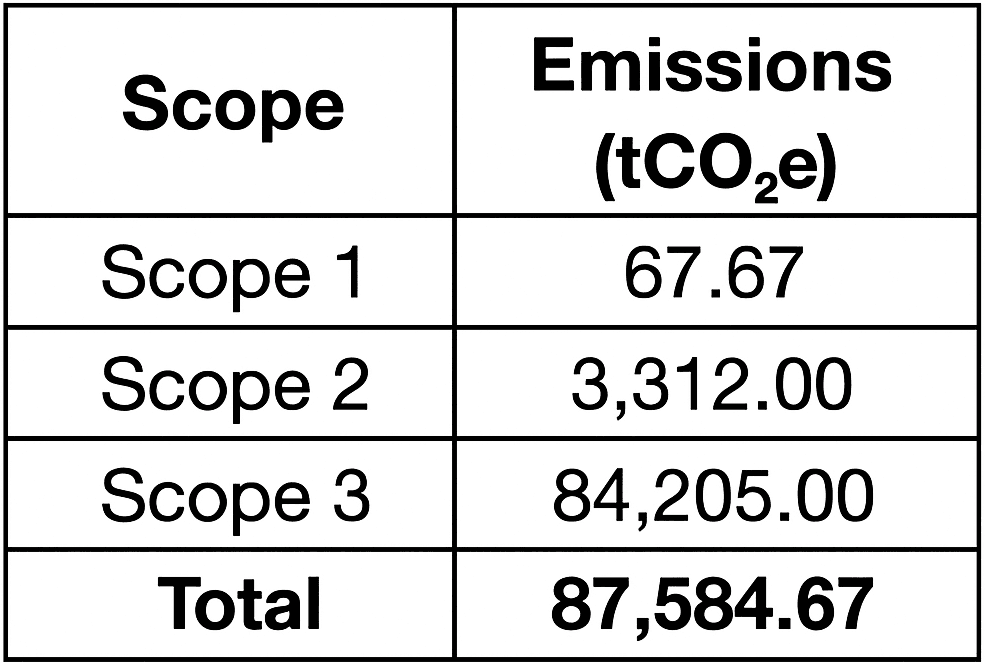
Translating for the Reporting Company (PSU)
For the PSU, all construction emissions are accounted as Scope 3 – Capital Goods.
- Capital Goods Emissions: 87,584 tCO₂e
- Site Visit Travel (mobile combustion): ~30 tCO₂e
This distinction is crucial for ESG reporting under frameworks like BRSR, GRI, and TCFD.
Towards Net Zero: Timeline vs. Life Cycle Views
Annual Net Zero Roadmap
- Considers yearly emissions and offsets
- Possible achievement by 2037 through progressive reductions and offsets
Cumulative Net Zero (Life Cycle View)
- Includes embodied emissions from construction
- Requires higher cumulative offsets (~846,000 tCO₂e)
- Net Zero achieved by 2039 with accelerated offsetting
Conclusion
Construction emissions are no longer invisible. As sustainability moves from intent to action, the ability to measure, manage, and mitigate construction-phase emissions is essential. Whether you’re a builder, consultant, or asset owner, factoring in embodied carbon and creating a robust offset strategy is key to credible net-zero action.
Need help mapping construction emissions? Contact us at [email protected]